This week I have been thinking about assessment and evaluation, which have come up often as topics of discussion. A physics teacher at one of the local high schools recently gave a talk on how he does grading. His main idea was that he was looking for evidence of individual competencies, and any time a student showed that would be sufficient. Therefore, his final exams were unique to each student, and only tested what that student had not yet mastered. It could only bring a grade up, not down. He stressed that the reason this method works for Physics is due to a cumulative nature of those courses: foundational techniques are continually reapplied in more and more complex situations. He said that the same thing may not work for other subjects (such as in Math and French), where such repetition is not built-in. An example given by one of my peers is French verb conjugation: if you get it right on the midterm, but not on the final exam, it could be hard to say proficiency has been shown.
However, as I think about it again, this may be a reason to consider restructuring the “typical” way a course is taught. Should not such skills as factoring and verb conjugation be practiced within the context of many different situations?
Regardless, I created some Google spreadsheets (which you can view and comment on here) as examples that might-could be used in end-of-term evaluations. The first (Whole-curriculum) uses a similar method to that of that physics teacher, though maybe less sophisticated. The criteria are directly copied from the curriculum, including both the curricular competencies and the content. For each individual item from the curriculum, we take the highest level of proficiency shown in any evidence type. Averages are taken within categories, and then a weighted average across categories represents an overall mark.
The second type uses just the criteria categories from this framework (available with other classroom assessment resources here). More specific criteria are not yet available for all subject areas and grade levels in that framework, but one can create one’s own. However, my idea for this type of sheet was just to assume that’s done elsewhere, possibly with a rubric. These sheets will just give an overview of how the student is doing within the five categories, and take an average, weighted across evidence types as appropriate. Since that framework document breaks down assessment categories for four different subject areas covering pretty much all of academic work at high school, I made one of these sheets for each: Math, Science, Social Studies, and Language Arts.
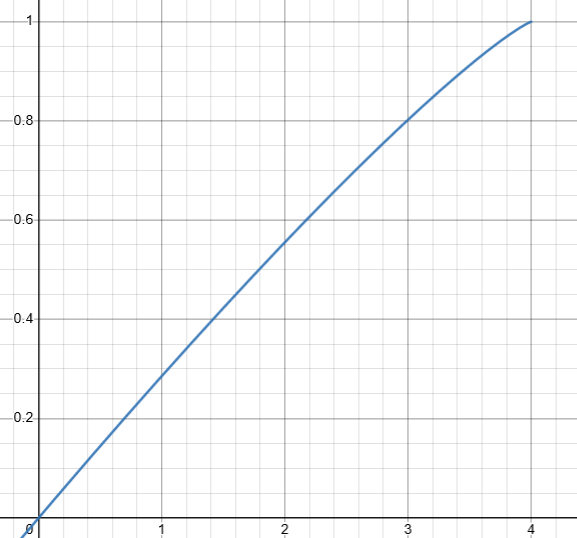
For both kinds of sheet, I used one method to convert from the proficiency scale into a grade and percentage. It’s based on this document on converting between proficiency and the old performance-based letter grades, and this document which relates those letter grades to percentages. Creating it has renewed my bitter disdain for this whole idea of representing student achievement as a number, and brought me to utter confusion as to how anyone could have thought the statement, “The student demonstrates very good performance in relation to expected learning outcomes for the course or subject and grade,” in any way clarifies what a B should look like. The only thing varying between most of the letter grades is a single adjectival phrase: “not minimally acceptable, minimally acceptable, satisfactory, good, very good, excellent or outstanding.” 😑🙄😂🙃😬😠 Anyway, my finding is as follows: No evidence is (unfortunately) 0%, Emerging is 30%, Developing is 55%, Proficient is 80%, and Extending is 100%. I chose those values to stay within the guidelines but also create a nice shape suggesting consistent improvement. Thanks once again to Desmos, I found a formula that creates a smooth, simple curve close to that shape: proficiency x on a scale from 0 to 4 becomes the percentage 1-(1-x/4)^(117/110).

And if you would like to copy any of the sheets for your own use, please do!
