
I got another useful idea in this article. Different tones within a sound stimulate different regions of the basilar membrane within the inner ear. If two tones stimulate partially overlapping regions, dissonance is perceived, and if they stimulate fully overlapping regions, consonance. The key is that natural sounds are composed of a series of tones, and the interaction between two sounds will have many overlaps.
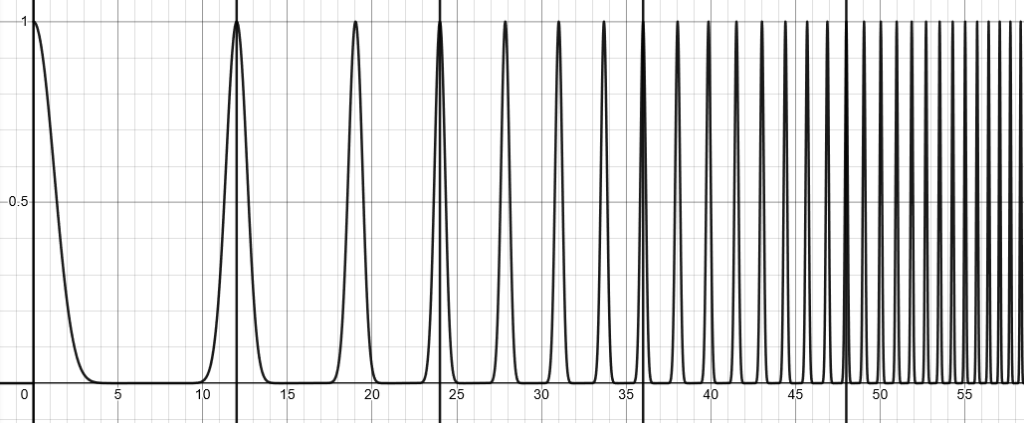
Inspired, I improved on an interactive graph I’ve been working on in Desmos graphing calculator. Below is an example depicting how the overtones of a note relate to standard tuning. The units of the x-axis represent positions on a standard piano, so 1 to the right is a semitone up and 12 to the right is an octave. The solid black vertical lines represent the a root note and the octaves above it, and the peaks are the root’s overtones.
The more complex version of the graph shows some interactions within a chord. In the video below, we examine a chord with root note at x=0. The dashed vertical line is the chord’s fifth, and the dotted one is a movable note I’ll call M, which can be animated to change the quality of the chord. The different-coloured peaks represent overlaps in overtones: the green ones are from the root and M, the red ones are from M and the fifth, and the blue ones are from the root and the fifth. You’ll notice that the blue peaks are constant, since they come from the two unchanging notes (which, on their own, comprise a power chord). Finally, the black peaks are overlaps of tones shared by all three notes.
The overlap explanation is compelling here, but perhaps is an incomplete story. I notice that the most audibly dissonant chords (M = 1, 6, or 8) have a partial black peak under the first blue one, then a region where M interacts with just one of the power chord’s notes, and then chaos. On the other hand, the most consonant chords have their own series of black peaks. For next time, I’ll make recordings of what these chords sound like and explore some more of what these graphs might be telling us.